5. Cloud Setup
The cloud setup follows a similar approach to the one described in the DIAS Kuksa setup, Step 3: Cloud Setup. MQTT data published by the mqtt client will be received in the Bosch IoT Hub, where a Hono entry point exists. A Hono consumer will read the data from the hub, and saves it into a InfluxDB table. After that, Grafana reads the data saved into the database, and displays its content.
5.1 Requirements
To follow this page, several things are required:
A Bosch IoT Hub subscription. If you don’t have one a detailed guide on how to obtain one can be found here.
A Ubuntu Virtual Machine.
Docker. Instalation guide can be found on this link `<https://docs.docker.com/engine/install/ubuntu/>_.
5.2 InfluxDB Setup
For the present use case, InfluxDB will be used to store logs published by LogPublisher to Bosch IoT Hub, as data time series.
Ubuntu setup:
sudo apt install curl git maven

curl -s https://repos.influxdata.com/influxdb.key | gpg --dearmor > /etc/apt/trusted.gpg.d/influxdb.gpg

export DISTRIB_ID=$(lsb_release -si); export DISTRIB_CODENAME=$(lsb_release -sc)

echo "deb [signed-by=/etc/apt/trusted.gpg.d/influxdb.gpg] https://repos.influxdata.com/${DISTRIB_ID,,} ${DISTRIB_CODENAME} stable" > /etc/apt/sources.list.d/influxdb.list

sudo apt-get update && sudo apt-get install influxdb

sudo systemctl enable influxdb

sudo systemctl start influxdb
5.3 Hono Consumer Setup
The Hono consumer client is meant to read log data published to Bosch IoT Hub, and write it in Influxdb. The client can be installed and compiled manually, or via a Docker.
Manual setup:
git clone https://github.com/terilenard/dias-cloud-umfst.git

cd dias-cloud-umfst/Consumer

mvn clean package -DskipTests  # Build the project

java -jar target/maven.consumer.hono-0.0.1-SNAPSHOT.jar --hono.client.tlsEnabled=true --hono.client.username=messaging@<tenant_id> --hono.client.password=<password> --tenant.id=<tenant_id> --device.id=<deviceId> --export.ip=localhost:8086
Docker setup:
git clone https://github.com/terilenard/dias-cloud-umfst.git

cd dias-cloud-umfst/Consumer

docker build -t hono-log-consumer .

docker run -p 8081:8081 -t hono-log-consumer --hono.client.tlsEnabled=true --hono.client.username=messaging@t6906174622ff488ba9b97d1fefc53459 --hono.client.password=dsbvXtn5fImqNUGa88kw --tenant.id=t6906174622ff488ba9b97d1fefc53459 --device.id=1234 --server.url=http://<VM IP>:8086
5.4 Grafana Setup
Ubuntu setup of Grafana can be found here . The same steps are listed below for convenience:
sudo apt-get install -y apt-transport-https

sudo apt-get install -y software-properties-common wget

wget -q -O - https://packages.grafana.com/gpg.key | sudo apt-key add -

echo "deb https://packages.grafana.com/oss/deb stable main" | sudo tee -a /etc/apt/sources.list.d/grafana.list

sudo apt-get update

sudo apt-get install grafana

sudo systemctl start grafana-server
Grafana can be access via a web browser on http://<local-ip>:3000. The default login username is admin and default login password is admin.
First off all, InfluxDB must be linked with Grafana. On the main page, select Data Source square, and click on the row associated with InfluxDB. Here the following fields must be set to:
DATABASE: dias_log
User: admin
Password: admin
and then Save.
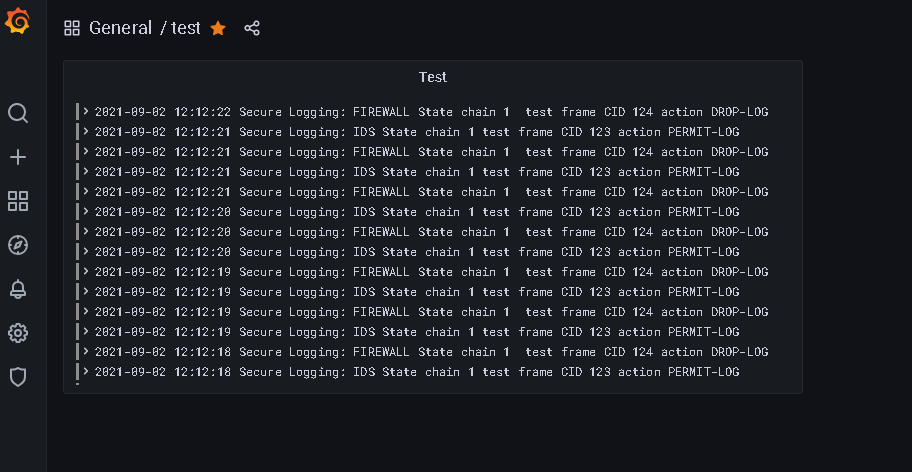
To view the data saved in InfluxDB in Grafana, a new Panel must be created.
To extract all logs, under Query tab, modify the query statement as SELECT “time”,”value” FROM logs;.
After that modify in the Panel Options, on the left side of the editing page, the Visualizations style into Logs. This is set by default to Time series.
Don’t forget to save your changes by clicking Apply, on the top right button, after every step.
If everything is successful you should be able to see the logs in grafana as follows: